
San Francisco · Q2 2026
San Francisco’s economy in numbers.
From transit and housing to offices and small business, tracked over time.
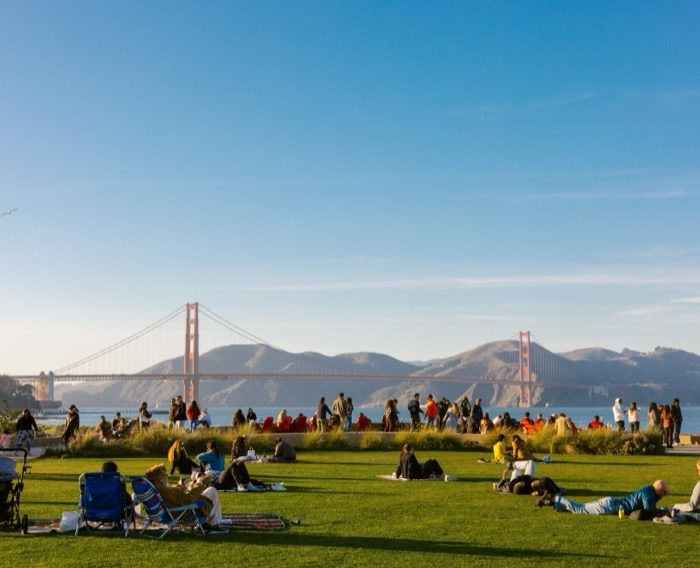
Transit at a post-pandemic high. Office vacancy falling. New businesses opening.
In the first half of 2026, transit ridership, office absorption, and new business filings all moved the same way: up.
Transportation · San Francisco
Muni at a post-pandemic daily high. BART downtown exits up 22.8% in two years.
BART downtown exits climbed from 269,000 per week in early 2024 to 331,000 by Q1 2026. Muni hit 517,000 average daily boardings in June, the highest since before the pandemic. This tab covers BART, Muni, Bay Area bridge crossings, and SFO passenger traffic.
BART Ridership · Downtown Core · Jan 2024–Apr 2026
Downtown SF is filling back in.
Average weekly BART exits at the four downtown core stations (Embarcadero, Montgomery St, Powell St, and Civic Center) climbed from about 269,000 in early 2024 to 331,000 by early 2026. Because these stations sit at the heart of the financial and retail district, their ridership tracks the return of foot traffic more directly than employment data.
Monthly exits, downtown core
Jan 2024 – Apr 2026 · four core stations
Jan–Apr, year over year
Like-for-like comparison of the same four-month window
Bridge Crossings · Inbound to SF · 2019–2026
Bridge crossings into SF have held near 43 million a year since 2022.
Bay Area toll bridges delivered 42.96 million vehicle trips into San Francisco in 2025, down 9.5% from the 2019 peak of 47.5 million but within 1% of every year since 2022.
Annual bridge crossings
2019–2026 · 2026 is Jan–May YTD only
Monthly crossings by year
Seasonal pattern: 2019, 2024, 2025, 2026 partial
Muni Bus & Rail · Average Daily Weekday Boardings · Jul 2018–Jun 2026
Muni hits a new post-pandemic high, growing every year since 2022.
Muni's average weekday ridership has grown every year since 2022, reaching 517,000 daily boardings in June 2026. The 2025 annual average of 503,257 was up 4.1% from 2024; the Jan–Jun 2026 pace of 521,566 is tracking above that.
Monthly avg weekday boardings
Jan 2024 – Jun 2026
Annual avg daily boardings
2019–2026 · 2026 is Jan–Jun average only
Muni has posted a new ridership high every year since 2022. The 2025 annual average of 503,257/day was up 4.1% from 2024. The 2026 Jan–Jun pace of 521,566/day is running ahead of 2025.
SFO Air Passengers · Total Monthly Traffic · Jan 2022–Mar 2026
SFO carried 54.4 million passengers in 2025, the highest annual total on record.
San Francisco International Airport has set a new annual passenger record each year since 2022. Monthly traffic peaked at 5.27 million in July 2025. Through March 2026, the airport is running 3.4% ahead of the same period last year.
Monthly passengers, SFO
Jan 2022 – Mar 2026 · all airlines combined
Annual passenger totals
2022–2026 · 2026 reflects Jan–Mar only
SFO has set a new annual passenger record each year since 2022. The 2025 total of 54.4 million was up 4.3% from 2024. The 2026 Jan–Mar pace of 4.1M/month is running ahead of the same window last year.
Housing · San Francisco · 2005–Present
SF completed 61,312 homes since 2005, with 35,204 affordable units in the city’s portfolio.
SF averaged 2,920 housing units a year from 2005 through 2025, with a low of 1,527 in 2024 and 3,047 in 2025. The city’s affordable housing pipeline covers 9,756 units across 176 active projects, with 63 under construction.
Housing Production · 2005–2025
Production peaked at 5,607 units in 2021, then fell back.
The 2021 peak of 5,607 units was driven by permits from the mid-2010s boom. SF completed 1,527 units in 2024 and 3,047 in 2025.
Annual housing production
Net units completed per year · SF Planning records · 2005–2025
Affordable Housing · MOHCD Portfolio & Pipeline
MOHCD tracks 850 completed projects and 176 active.
The Mayor’s Office of Housing and Community Development (MOHCD) portfolio covers 35,204 affordable units across 850 completed projects, including 6,288 for seniors and 5,628 for people experiencing homelessness. The active pipeline has 63 projects under construction and 113 in pre-construction.
Affordable units by population served
MOHCD completed portfolio · 35,204 units across 850 projects
Rent Control · Annual Allowable Increase · 1982–2026
The 2026 rent increase cap is 1.6%, matching 2018.
The SF Rent Board sets the annual allowable increase each March, using CPI indexing since 1993. The rate has ranged from 0.1% (2010) to 3.6% (2023); 2026 is 1.6%, effective March 1.
Annual allowable rent increase
Units under rent control · SF Rent Board · 1982–2026 · amber bars pre-date CPI indexing (pre-1993)
Office Activity · San Francisco · Q2 2026
Four straight quarters of positive absorption have pulled SF office vacancy to 32%.
San Francisco's 87.6-million-square-foot office market absorbed 2.1 million square feet in the first half of 2026, with total vacancy falling to 32.0% from 35.4% a year ago. Office requirements citywide stand at 10 million square feet, the highest since 2019, with more than 25 tenants searching for blocks above 100,000 square feet.
Citywide Office Market · Q2 2026
Vacancy is down 3.4 points in a year.
The City of San Francisco signed a 502,000 s.f. lease in Mid-Market this quarter, the largest single transaction in the period. Average effective rents are up roughly 15% year-over-year to $66 p.s.f., led by Bay Bridge view spaces now averaging $140 p.s.f.
Office by Submarket · Q2 2026
Mission Bay and periphery submarkets are tightest.
Mission Bay/China Basin carries the lowest vacancy at 13.5% and the highest direct asking rent at $99.36 p.s.f. Mid-Market and SoMa remain the highest-vacancy submarkets at 51.1% and 46.5%. The CBD average sits at 31.4%, with the South Financial District (28.8%) outperforming the North Financial District (34.1%).
Total vacancy by submarket
Q2 2026 · direct + sublease · sorted highest to lowest
Direct asking rent by submarket
Q2 2026 · $ per s.f. annually · sorted highest to lowest
Registered Businesses · San Francisco · July 2026
167,711 businesses
are active in SF.
San Francisco has 167,711 active registered businesses across its neighborhoods and commercial corridors. The Financial District alone accounts for 13.5% of all active registrations, more than the Mission, SoMa, and Chinatown combined. 12,246 new businesses registered in 2025, the fourth straight year above 12,000.
New business registrations per year
SF Office of the Treasurer & Tax Collector · 2015–2025
San Francisco has recorded 12,000–12,600 new business registrations every year since 2022. At the 2025 pace of 12,246, that works out to 33 new registrations per day.
Active businesses by neighborhood
Top 10 SF neighborhoods · active registrations only
Active businesses by sector
Top 10 NAICS categories · businesses with classification on file
Active businesses by commercial corridor
Top 10 designated corridors · active registrations only